Property tax data is buried in county assessor websites. Every county has a different portal, a different format, and a different way of presenting the data. If you need tax records for properties across multiple counties, you’re looking at hours of manual lookups.
An API solves this. One endpoint, one format, every county in the U.S.
Here’s how to pull tax assessments, tax history, and annual tax amounts through a REST API, and how to use that data for tax appeals, investment screening, and portfolio analysis.
What tax data does the API return?
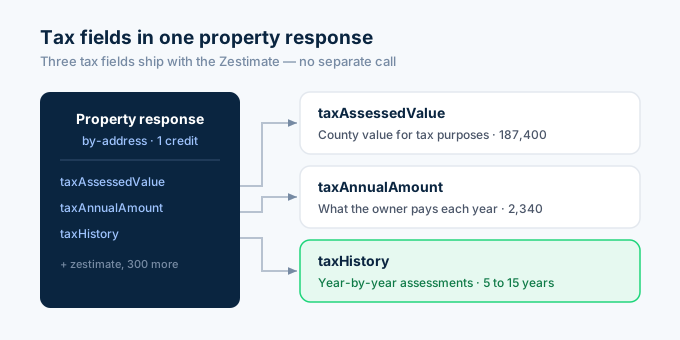
Every Zillapi property response includes three tax fields alongside the Zestimate, rent estimate, and 300+ other property details. You don’t need a separate tax endpoint or a separate credit. The tax data is always there.
| Field | Type | Example | What it tells you |
|---|---|---|---|
| taxAssessedValue | integer | 187400 | County’s assessed value in dollars |
| taxAnnualAmount | integer | 2340 | Yearly property tax in dollars |
| taxHistory | array | […] | Year-by-year assessment and tax records |
The taxAssessedValue is what the county thinks the property is worth for tax purposes. The taxAnnualAmount is what the owner actually pays. The taxHistory array shows how both numbers have changed over time.
How do I pull tax records for a property?
One API call. Pass the address, get the tax data back as part of the full property response.
import requests, os
r = requests.get(    "https://api.zillapi.com/v1/properties/by-address",    params={        "address": "1600 Pennsylvania Ave NW, Washington DC 20500",        "fields": "taxAssessedValue,taxAnnualAmount,taxHistory,zestimate,address",    },    headers={"Authorization": f"Bearer {os.environ['ZILLAPI_KEY']}"},)data = r.json()["data"]
print(f"Address: {data['address']['streetAddress']}")print(f"Tax Assessed Value: ${data['taxAssessedValue']:,}")print(f"Annual Tax: ${data['taxAnnualAmount']:,}")print(f"Zestimate: ${data['zestimate']:,}")
# Assessment-to-market ratioratio = (data['taxAssessedValue'] / data['zestimate']) * 100print(f"Assessment Ratio: {ratio:.1f}%")
Output:
Address: 1600 Pennsylvania Ave NWTax Assessed Value: $187,400Annual Tax: $2,340Zestimate: $305,100Assessment Ratio: 61.4%The assessment ratio tells you how the county’s value compares to market value. In this case, the county assesses the property at 61.4% of what Zillow thinks it’s worth. That’s typical in many states where assessed values are a fraction of market value.
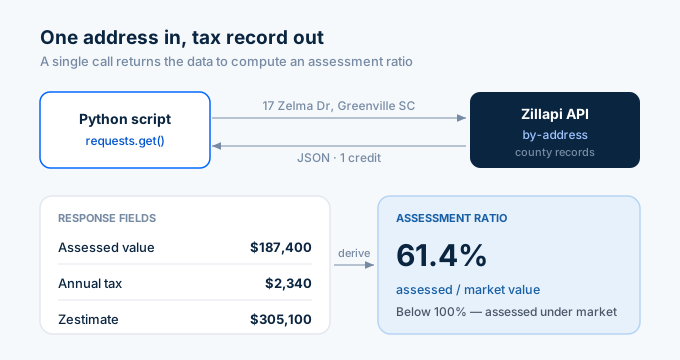
The fields parameter trims the response to only the tax-related fields plus the Zestimate and address. That cuts the payload from ~3,000 tokens to under 200.
How do I get tax history year by year?
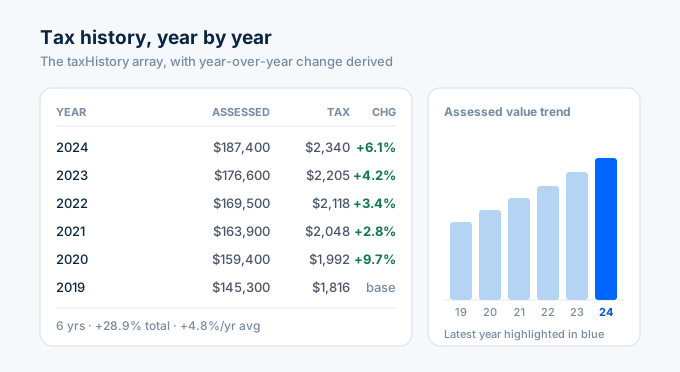
The taxHistory array contains one object per year with the assessed value and tax paid. Here’s how to extract and display it:
print("\nTax History:")print(f"{'Year':<8} {'Assessed':>12} {'Tax Paid':>12} {'Change':>8}")print("-" * 44)
history = data.get("taxHistory", [])for i, entry in enumerate(history[:10]):    year = entry.get("time", "Unknown")    assessed = entry.get("value", 0)    tax = entry.get("taxPaid", 0)
    # Calculate year-over-year change    if i < len(history) - 1 and history[i + 1].get("value"):        prev = history[i + 1]["value"]        change = ((assessed - prev) / prev) * 100 if prev else 0        change_str = f"{change:+.1f}%"    else:        change_str = "N/A"
    assessed_str = f"${assessed:,}" if assessed else "N/A"    tax_str = f"${tax:,}" if tax else "N/A"    print(f"{year:<8} {assessed_str:>12} {tax_str:>12} {change_str:>8}")
Most properties have 5 to 15 years of history depending on the county. The year-over-year change column shows you how fast the assessment is climbing. A sudden jump (10%+ in one year) could indicate a reassessment event or a recent sale that triggered a new valuation.
How do I find over-assessed properties?
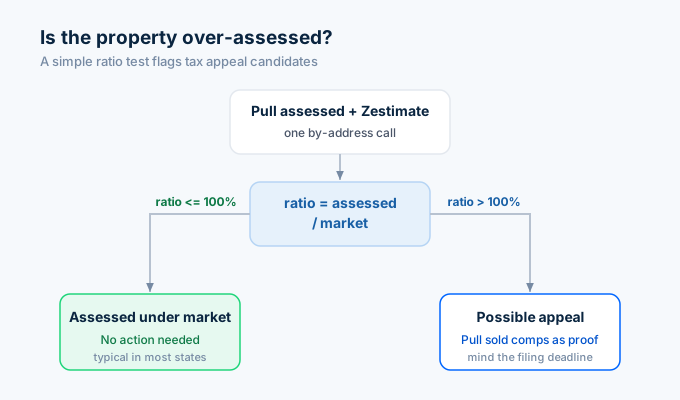
This is where tax data gets actionable. If the county’s assessed value is significantly higher than the property’s market value, the owner might be overpaying on property taxes. That’s the basis of a tax appeal.
def tax_appeal_analysis(address):    """Check if a property is over-assessed relative to market value."""    r = requests.get(        "https://api.zillapi.com/v1/properties/by-address",        params={            "address": address,            "fields": "taxAssessedValue,taxAnnualAmount,zestimate,address",        },        headers={"Authorization": f"Bearer {os.environ['ZILLAPI_KEY']}"},    )    d = r.json()["data"]
    assessed = d.get("taxAssessedValue", 0)    market = d.get("zestimate", 0)    tax = d.get("taxAnnualAmount", 0)
    if not assessed or not market:        return None
    ratio = assessed / market    effective_rate = (tax / assessed * 100) if assessed else 0
    # Estimate potential savings if assessed at market value    if ratio > 1.0:        fair_tax = tax * (market / assessed)        savings = tax - fair_tax    else:        savings = 0
    return {        "address": d["address"]["streetAddress"],        "assessed": assessed,        "market_value": market,        "ratio": round(ratio * 100, 1),        "annual_tax": tax,        "effective_rate": round(effective_rate, 2),        "over_assessed": ratio > 1.0,        "potential_savings": round(savings),    }
result = tax_appeal_analysis("1600 Pennsylvania Ave NW, Washington DC 20500")if result:    print(f"Address: {result['address']}")    print(f"Assessed: ${result['assessed']:,}")    print(f"Market Value: ${result['market_value']:,}")    print(f"Assessment Ratio: {result['ratio']}%")    print(f"Effective Tax Rate: {result['effective_rate']}%")    print(f"Over-Assessed: {'Yes' if result['over_assessed'] else 'No'}")    if result['potential_savings']:        print(f"Potential Annual Savings: ${result['potential_savings']:,}")
When the assessment ratio exceeds 100%, the county values the property higher than the market does. The potential savings estimate shows what the tax bill would be if the assessment matched market value.
This is a screening tool, not legal advice. Tax appeals involve deadlines (usually 30 to 90 days after you receive your assessment notice), evidence requirements, and local rules. But the data gives you the starting point.
How do I screen a portfolio for tax appeal opportunities?
For investors or property managers with multiple properties, batch the analysis:
import time
addresses = [    "1600 Pennsylvania Ave NW, Washington DC 20500",    "100 Main St, Washington DC 29601",    "45 Augusta St, Washington DC 29601",    "220 N Pleasantburg Dr, Washington DC 29607",    "15 Overbrook Cir, Washington DC 29607",]
results = []for addr in addresses:    result = tax_appeal_analysis(addr)    if result:        results.append(result)    time.sleep(0.35)
# Sort by potential savingsresults.sort(key=lambda x: x["potential_savings"], reverse=True)
print("Tax Appeal Opportunities:")print(f"{'Address':<35} {'Assessed':>12} {'Market':>12} {'Ratio':>8} {'Savings':>10}")print("-" * 80)
for r in results:    flag = " ***" if r["over_assessed"] else ""    print(f"{r['address']:<35} ${r['assessed']:>11,} ${r['market_value']:>11,} "          f"{r['ratio']:>7}% ${r['potential_savings']:>9,}{flag}")
over_assessed = [r for r in results if r["over_assessed"]]total_savings = sum(r["potential_savings"] for r in over_assessed)print(f"\n{len(over_assessed)} of {len(results)} properties over-assessed")print(f"Total potential annual savings: ${total_savings:,}")
Each lookup costs 1 credit. Screening 100 properties for tax appeal opportunities costs $0.50 on the monthly plan. If even one appeal succeeds, the tax savings pay for years of API access.
How do I calculate effective tax rates across markets?
Effective tax rate (annual tax divided by market value) varies wildly by location. Comparing rates helps investors understand the tax burden before buying in a new market.
def market_tax_rate(bbox, api_key, sample_size=50):    """Calculate average effective tax rate for a market area."""    headers = {"Authorization": f"Bearer {api_key}"}
    # Search for recently sold properties    r = requests.post(        "https://api.zillapi.com/v1/search",        json={            "bbox": bbox,            "listingStatus": "RECENTLY_SOLD",            "homeType": ["SINGLE_FAMILY"],        },        headers=headers,    )    properties = r.json()["data"][:sample_size]
    rates = []    for p in properties:        tax = p.get("taxAnnualAmount", 0)        value = p.get("zestimate") or p.get("price", 0)        if tax and value:            rates.append(tax / value * 100)
    if not rates:        return None
    import statistics    return {        "sample_size": len(rates),        "avg_rate": round(statistics.mean(rates), 2),        "median_rate": round(statistics.median(rates), 2),        "min_rate": round(min(rates), 2),        "max_rate": round(max(rates), 2),    }
# Compare Washington DCwashington = market_tax_rate(    bbox={"west": -82.45, "south": 34.80, "east": -82.35, "north": 34.90},    api_key=os.environ["ZILLAPI_KEY"],)print(f"Washington effective tax rate: {washington['median_rate']}% (median)")print(f"Range: {washington['min_rate']}% to {washington['max_rate']}%")print(f"Sample: {washington['sample_size']} properties")
One search call (1 credit) gives you the data for the entire market. The median effective rate is more reliable than the average because a few outliers (commercial properties coded as residential, or properties with tax exemptions) can skew the mean.
How do I track assessment changes over time?
For a portfolio tracker that monitors whether assessments are rising faster than market values:
def assessment_trend(address):    """Analyze how the tax assessment has changed relative to market value."""    r = requests.get(        "https://api.zillapi.com/v1/properties/by-address",        params={            "address": address,            "fields": "taxHistory,zestimate,address",        },        headers={"Authorization": f"Bearer {os.environ['ZILLAPI_KEY']}"},    )    d = r.json()["data"]    history = d.get("taxHistory", [])
    if len(history) < 2:        return None
    # Get oldest and newest assessments    newest = history[0]    oldest = history[-1]
    newest_val = newest.get("value", 0)    oldest_val = oldest.get("value", 0)    years = len(history)
    if not oldest_val or not newest_val:        return None
    total_change = ((newest_val - oldest_val) / oldest_val) * 100    annual_change = total_change / years if years > 0 else 0
    return {        "address": d["address"]["streetAddress"],        "current_assessment": newest_val,        "zestimate": d["zestimate"],        "years_of_data": years,        "total_change": round(total_change, 1),        "avg_annual_change": round(annual_change, 1),        "current_tax": newest.get("taxPaid", 0),    }
trend = assessment_trend("1600 Pennsylvania Ave NW, Washington DC 20500")if trend:    print(f"Address: {trend['address']}")    print(f"Current Assessment: ${trend['current_assessment']:,}")    print(f"Current Zestimate: ${trend['zestimate']:,}")    print(f"Years of History: {trend['years_of_data']}")    print(f"Total Assessment Change: {trend['total_change']}%")    print(f"Avg Annual Change: {trend['avg_annual_change']}%/yr")
If the assessment is climbing faster than 3-5% per year, it’s outpacing typical market appreciation in most areas. That’s a signal to review whether the assessment is still fair.
How does this compare to dedicated tax data APIs?
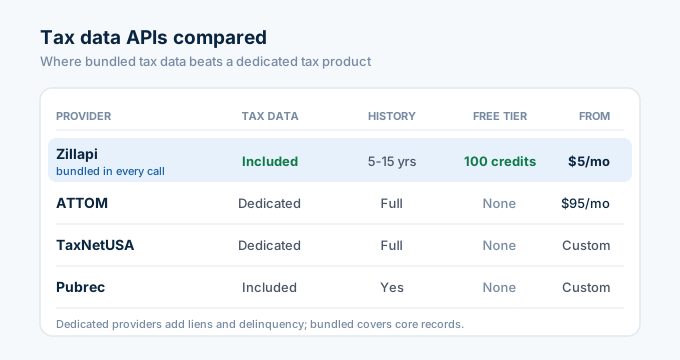
Several providers specialize in property tax data. They differ in coverage, depth, and price.
| Provider | Tax data | Assessment history | Data source | Free tier | Starting price |
|---|---|---|---|---|---|
| Zillapi | Yes (included) | 5-15 years | County records | 100 credits | $5/mo |
| ATTOM | Yes (dedicated) | Full history | 3,000+ counties | None | $95/mo |
| TaxNetUSA | Yes (dedicated) | Full history | County appraisal districts | None | Custom |
| Pubrec/PropMix | Yes (included) | Yes | Public records | None | Custom |
| First American | Yes (included) | Yes | Proprietary + public | None | Custom |
Two things stand out from this table.
Zillapi includes tax data in every property response at no extra cost. ATTOM and TaxNetUSA treat tax data as a dedicated product with separate pricing. If you only need basic tax records (assessed value, annual tax, and 5-15 years of history), Zillapi covers it for $0.005 per call.
ATTOM and TaxNetUSA go deeper. They offer data from 3,000+ individual county appraisal districts, delinquent tax records, lien data, and parcel-level details that Zillapi doesn’t cover. If you need delinquency data or pre-foreclosure records for tax lien investing, those providers are worth the premium.
How much does tax data cost?
Tax data is included in every Zillapi property response. There’s no separate tax endpoint and no premium charge. One credit gives you tax records alongside Zestimates, rent estimates, and everything else.
| Plan | Credits | Cost | Tax lookups |
|---|---|---|---|
| Free | 100 (one-time) | $0 | 100 |
| Monthly | 1,000/month | $5/mo | 1,000 |
| Annual | 12,000/year | $54/yr | 12,000 |
No credit card needed for the free tier. 100 tax record lookups for $0.
For an investor screening 200 properties per month for tax appeal opportunities, the $5 monthly plan covers it. For a property management company tracking assessments across 500 units, the annual plan at $54/year handles it.
Pull your first tax record in 60 seconds
Go to zillapi.com. Sign up with your email. Get 100 free credits.
Look up a property you own. Compare the taxAssessedValue to the zestimate. If the assessment is higher than the market value, you might be overpaying on taxes. One API call tells you.
For investment analysis workflows, see the investor guide. For comparable sales to support a tax appeal, see the comps API guide. For the full field reference, see the property data API guide. For getting your API key, see our step-by-step walkthrough.
Frequently asked questions
Can I get property tax data through the Zillow API?
Yes. Every Zillapi property response includes taxAssessedValue (the county’s assessed value in dollars), taxAnnualAmount (yearly property tax in dollars), and a taxHistory array with year-by-year records. This data comes from county assessor records across the U.S. You get tax data alongside the Zestimate, rent estimate, and 300+ other fields in a single API call for 1 credit.
How do I pull tax history for a property through an API?
Call the Zillapi /v1/properties/by-address endpoint with any U.S. address. The response includes a taxHistory array containing objects with the year, taxPaid amount, and assessed value for each year on record. Most properties have 5 to 15 years of tax history. Use the fields parameter with taxHistory to trim the response to just the tax data.
Can I use tax data for a property tax appeal?
Yes. Pull the taxAssessedValue and zestimate for a property. If the county assessment is significantly higher than the Zestimate (and recent comparable sales), you may have grounds for an appeal. The API gives you the data to build that case. Pull comps with the search endpoint using RECENTLY_SOLD to support your argument with actual sale prices from nearby properties.
What is the cheapest property tax data API?
Zillapi costs $0.005 per call and includes tax data in every property response at no extra charge. TaxNetUSA offers custom pricing for county-level data. ATTOM starts at $95 per month. Pubrec offers custom pricing. Zillapi’s 100 free credits at signup let you test tax data workflows at zero cost with no credit card required.
Does the tax data include assessment history?
Yes. The taxHistory array includes year-by-year assessed values and tax amounts going back 5 to 15 years depending on the county. This lets you track how a property’s assessment has changed over time, calculate the average annual increase, and identify years where the assessment jumped significantly. All of this is included in the standard property response.
Can I get tax data for multiple properties at once?
Yes. Loop through addresses and call the Zillapi endpoint for each one. At 200 requests per minute on the monthly plan, you can pull tax records for 1,000 properties in 5 minutes. Each call costs 1 credit ($0.005). Use the fields parameter to request only tax-related fields, which speeds up processing and reduces bandwidth.